GIS 255 term project report (excerpts)
Below are excerpts from a term project report that I wrote in one of my GIS courses (Introduction to Remote Sensing (GIS 255)) at Northern Virginia Community College. The purpose of the term project was the evaluation of several gap-filling techniques (necessary for filling the gaps present in all Landsat 7 imagery since 2003, when that satellite's scan line corrector failed) for purposes of change detection in the Aral Sea area. Several other students collaborated with me on this project; included below are only those sections of the project report that were written by me.
Analysis
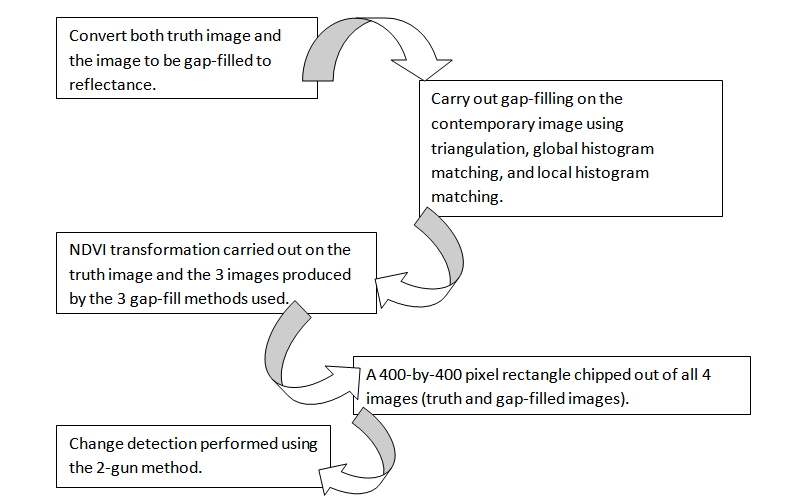
All imagery used was, when downloaded, processed to the L1T level. All imagery (both the truth image and the image to be gap-filled) was showing radiance; for further analysis, all imagery had to first be converted to reflectance. The next step after converting all imagery to reflectance was to carry out the gap-fill.
Three methods of gap filling were used. These were single-file gap fill (triangulation), two-band gap fill (global histogram matching), and two-band gap fill (local histogram matching). NDVI transformation was then carried out on all imagery, since change in vegetation health would need to be determined.
For change detection to be carried out, the extent of the truth image and the gap-filled images needed to match exactly. Therefore each image was loaded into a new display, and the displays linked so as to show exactly the same area. A rectangular area was chosen for change detection based on the presence of both filled gaps and large amounts of vegetation. The area, measuring 400 by 400 pixels and with its upper left-hand corner at 59° 13' 24.55'' east, 42° 49' 48.01'' north, was chipped out of each image. Change detection was then carried out using the 2 color-gun method. Truth data were loaded into the red and blue guns, the gap-filled image into the green. The truth dataset had a higher digital number, and the gap-filled dataset was subtracted from it, the unchanged areas appearing in gray.
(...)
Conclusions and general comments
Of the three gap-fill methods used, global histogram matching was easily the least suitable for change detection in our study area. Gaps could clearly be seen where the truth image was showing through them. Local histogram matching and single-file gap fill were both significantly better. In fact, it was hard to determine which was the better method of the two. However, with single-file gap fill, the location of gaps could still be determined—just barely—by small streaks of green (the gap-filled dataset), which were absent in the output of the local histogram matching method. Therefore we concluded that local histogram matching is the most appropriate method for change detection in our study area. In most of the image, vegetation appears less healthy in the newer (gap-filled) image than in the truth dataset.
Suggestions for further/future research
It might be worthwhile to compare the soil moisture content in the truth image and the gap-filled image. That would require determining whether the soils in the image are sandy or clayey. Soils with large amounts of clay-sized particles would have a high absorption rate (appear dark) at 1.4 and 2.2 micrometers. The next step would be to determine where reflectance has increased between the time the truth image and the contemporary image were captured. Higher reflectance in the water-absorption bands would indicate lower soil moisture. Depending on the findings of such analysis, it would be possible to determine whether soil moisture content of soils in the study area is increasing or decreasing.
